AI Agents
Specialized AI assistants within Proxa that enhance productivity by automating tasks, analyzing data, and ensuring data accuracy.
-
Creation Assistant Agent: Helps users build or modify content by suggesting relevant elements and layouts.
-
Analysis & Insights Agent: Identifies trends, generates projections, and provides actionable insights to inform decisions.
-
Data Governance Agent: Monitors and enforces data consistency and quality, alerting users to discrepancies.
-
Meta-Agent: Oversees and coordinates the activities of other AI agents to optimize system performance.
AI Chat

A conversational interface where users can query Proxa in natural language to receive instant data insights or navigation assistance.
-
Query Data: Retrieve specific information (e.g., “What is the status of X?”).
-
Navigation Assistance: Guides users to relevant areas within Proxa (e.g., Pages, Dashboards).
-
Generate Insights: Offers trend analysis, issue identification, and actionable recommendations.
Banner Zone

A predefined area at the top of a page that displays global metadata, such as the page title, summary, or status.
-
Purpose: Provides a quick overview of the page’s purpose or context.
-
Key Features: Customizable metadata and interactive elements like status editing.
-
Example Usage: Displaying project names and timelines on report pages.
Content Blocks
Reusable, modular units that are used to build and populate pages in Proxa, providing structural consistency and adaptability.
-
Purpose: Standardize layouts while maintaining flexibility in content presentation.
-
Key Features: Reusability, adaptability, and variations based on context.
-
Examples:
-
Banner Block: Displays high-level page information like title, summary, and metadata.
-
Data View Block: Organizes structured data in grid or card formats for visualization.
Data View Block


A content block that displays structured data in user-friendly formats like grids or cards.
-
Purpose: Enhance data visualization and user interaction.
-
Key Features: Sortable grids, filter options, and toggleable views (grid or card).
-
Example Usage: Presenting a company’s financial data or team performance metrics.
Drawer
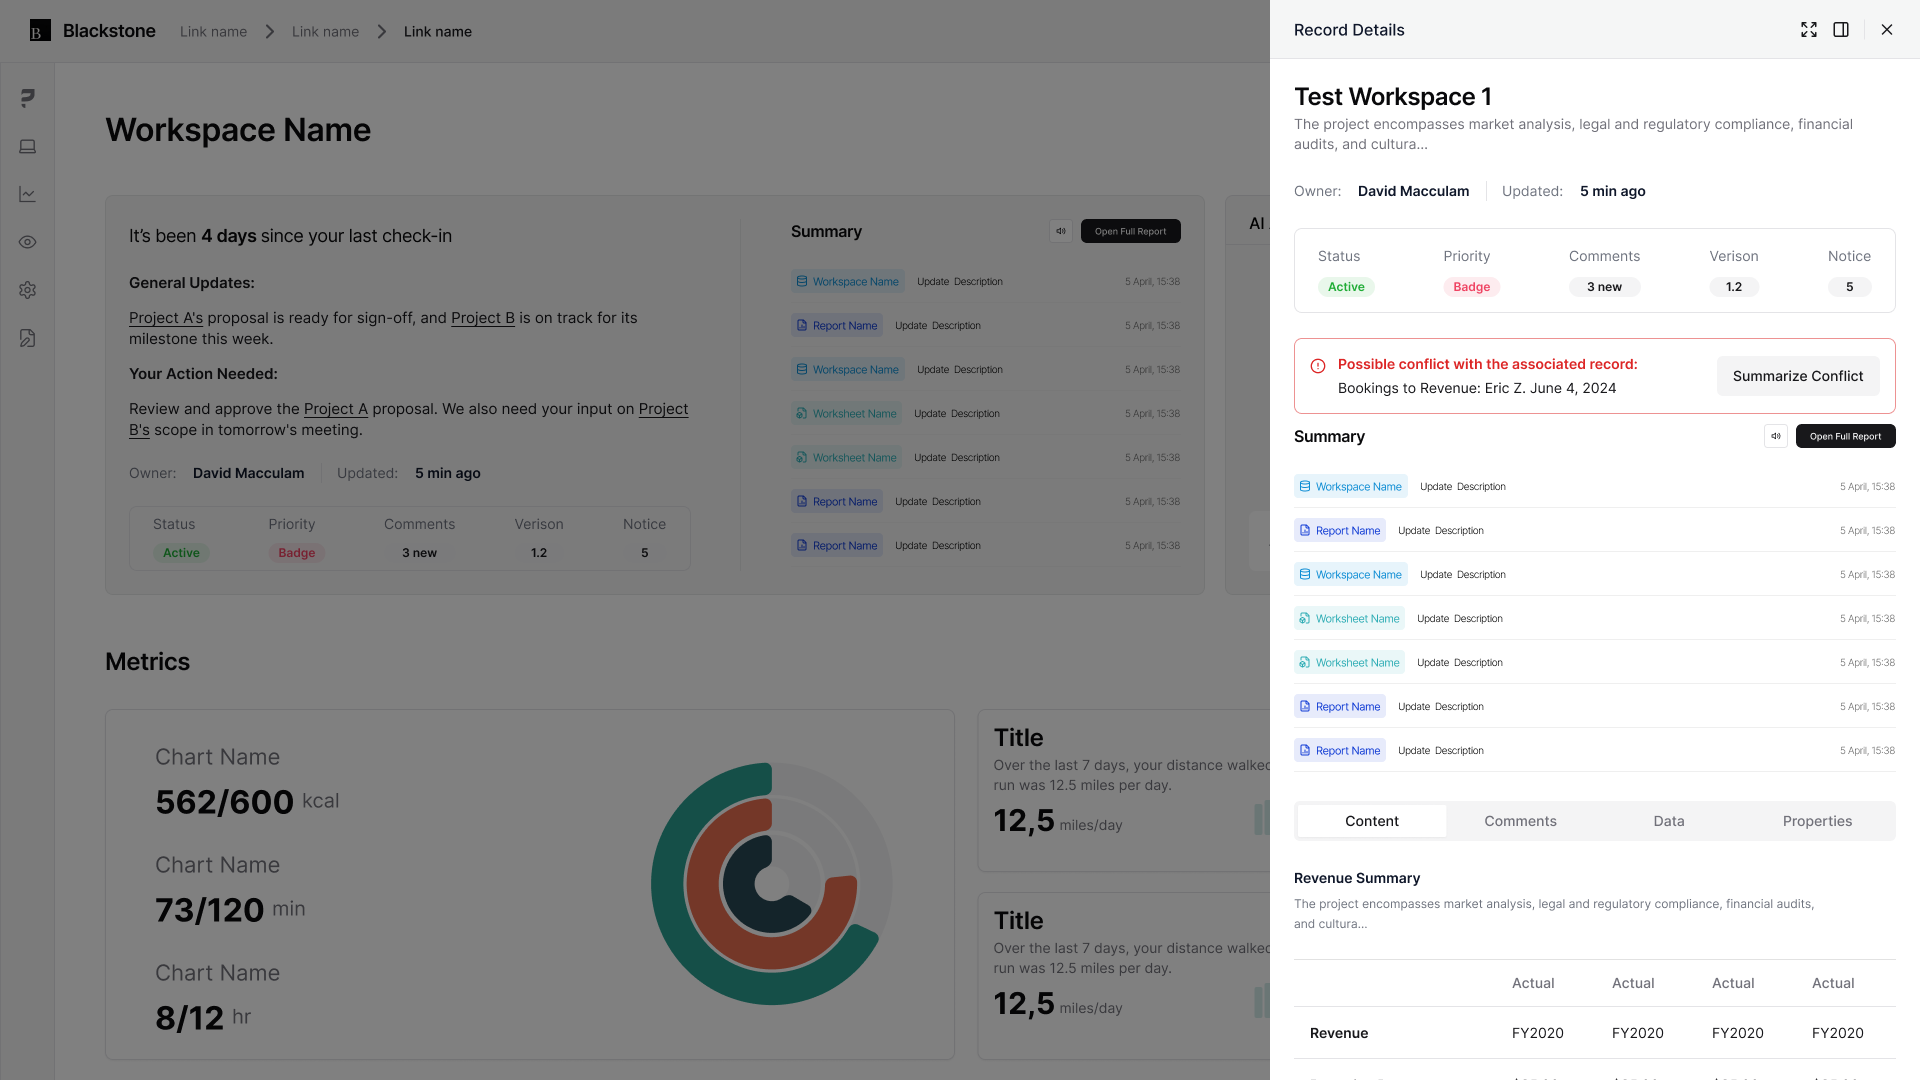
A collapsible side panel providing additional contextual information about a selected element, such as linked records or detailed reports.
-
Purpose: Offer detailed insights without disrupting the main workflow.
-
Key Features: Tabs for properties, content, and comments.
-
Example Usage: Accessing detailed descriptions of portfolio performance.
Header

The top section of a page, prominently displaying Proxa or customer branding and the title of the active page.
-
Purpose: Establish a consistent visual identity and orient users within the platform.
-
Key Features: Displays logo, page name, and sometimes navigation shortcuts.
-
Example Usage: A report page’s header may show the report’s title and organization name.
Interactive Dashboards
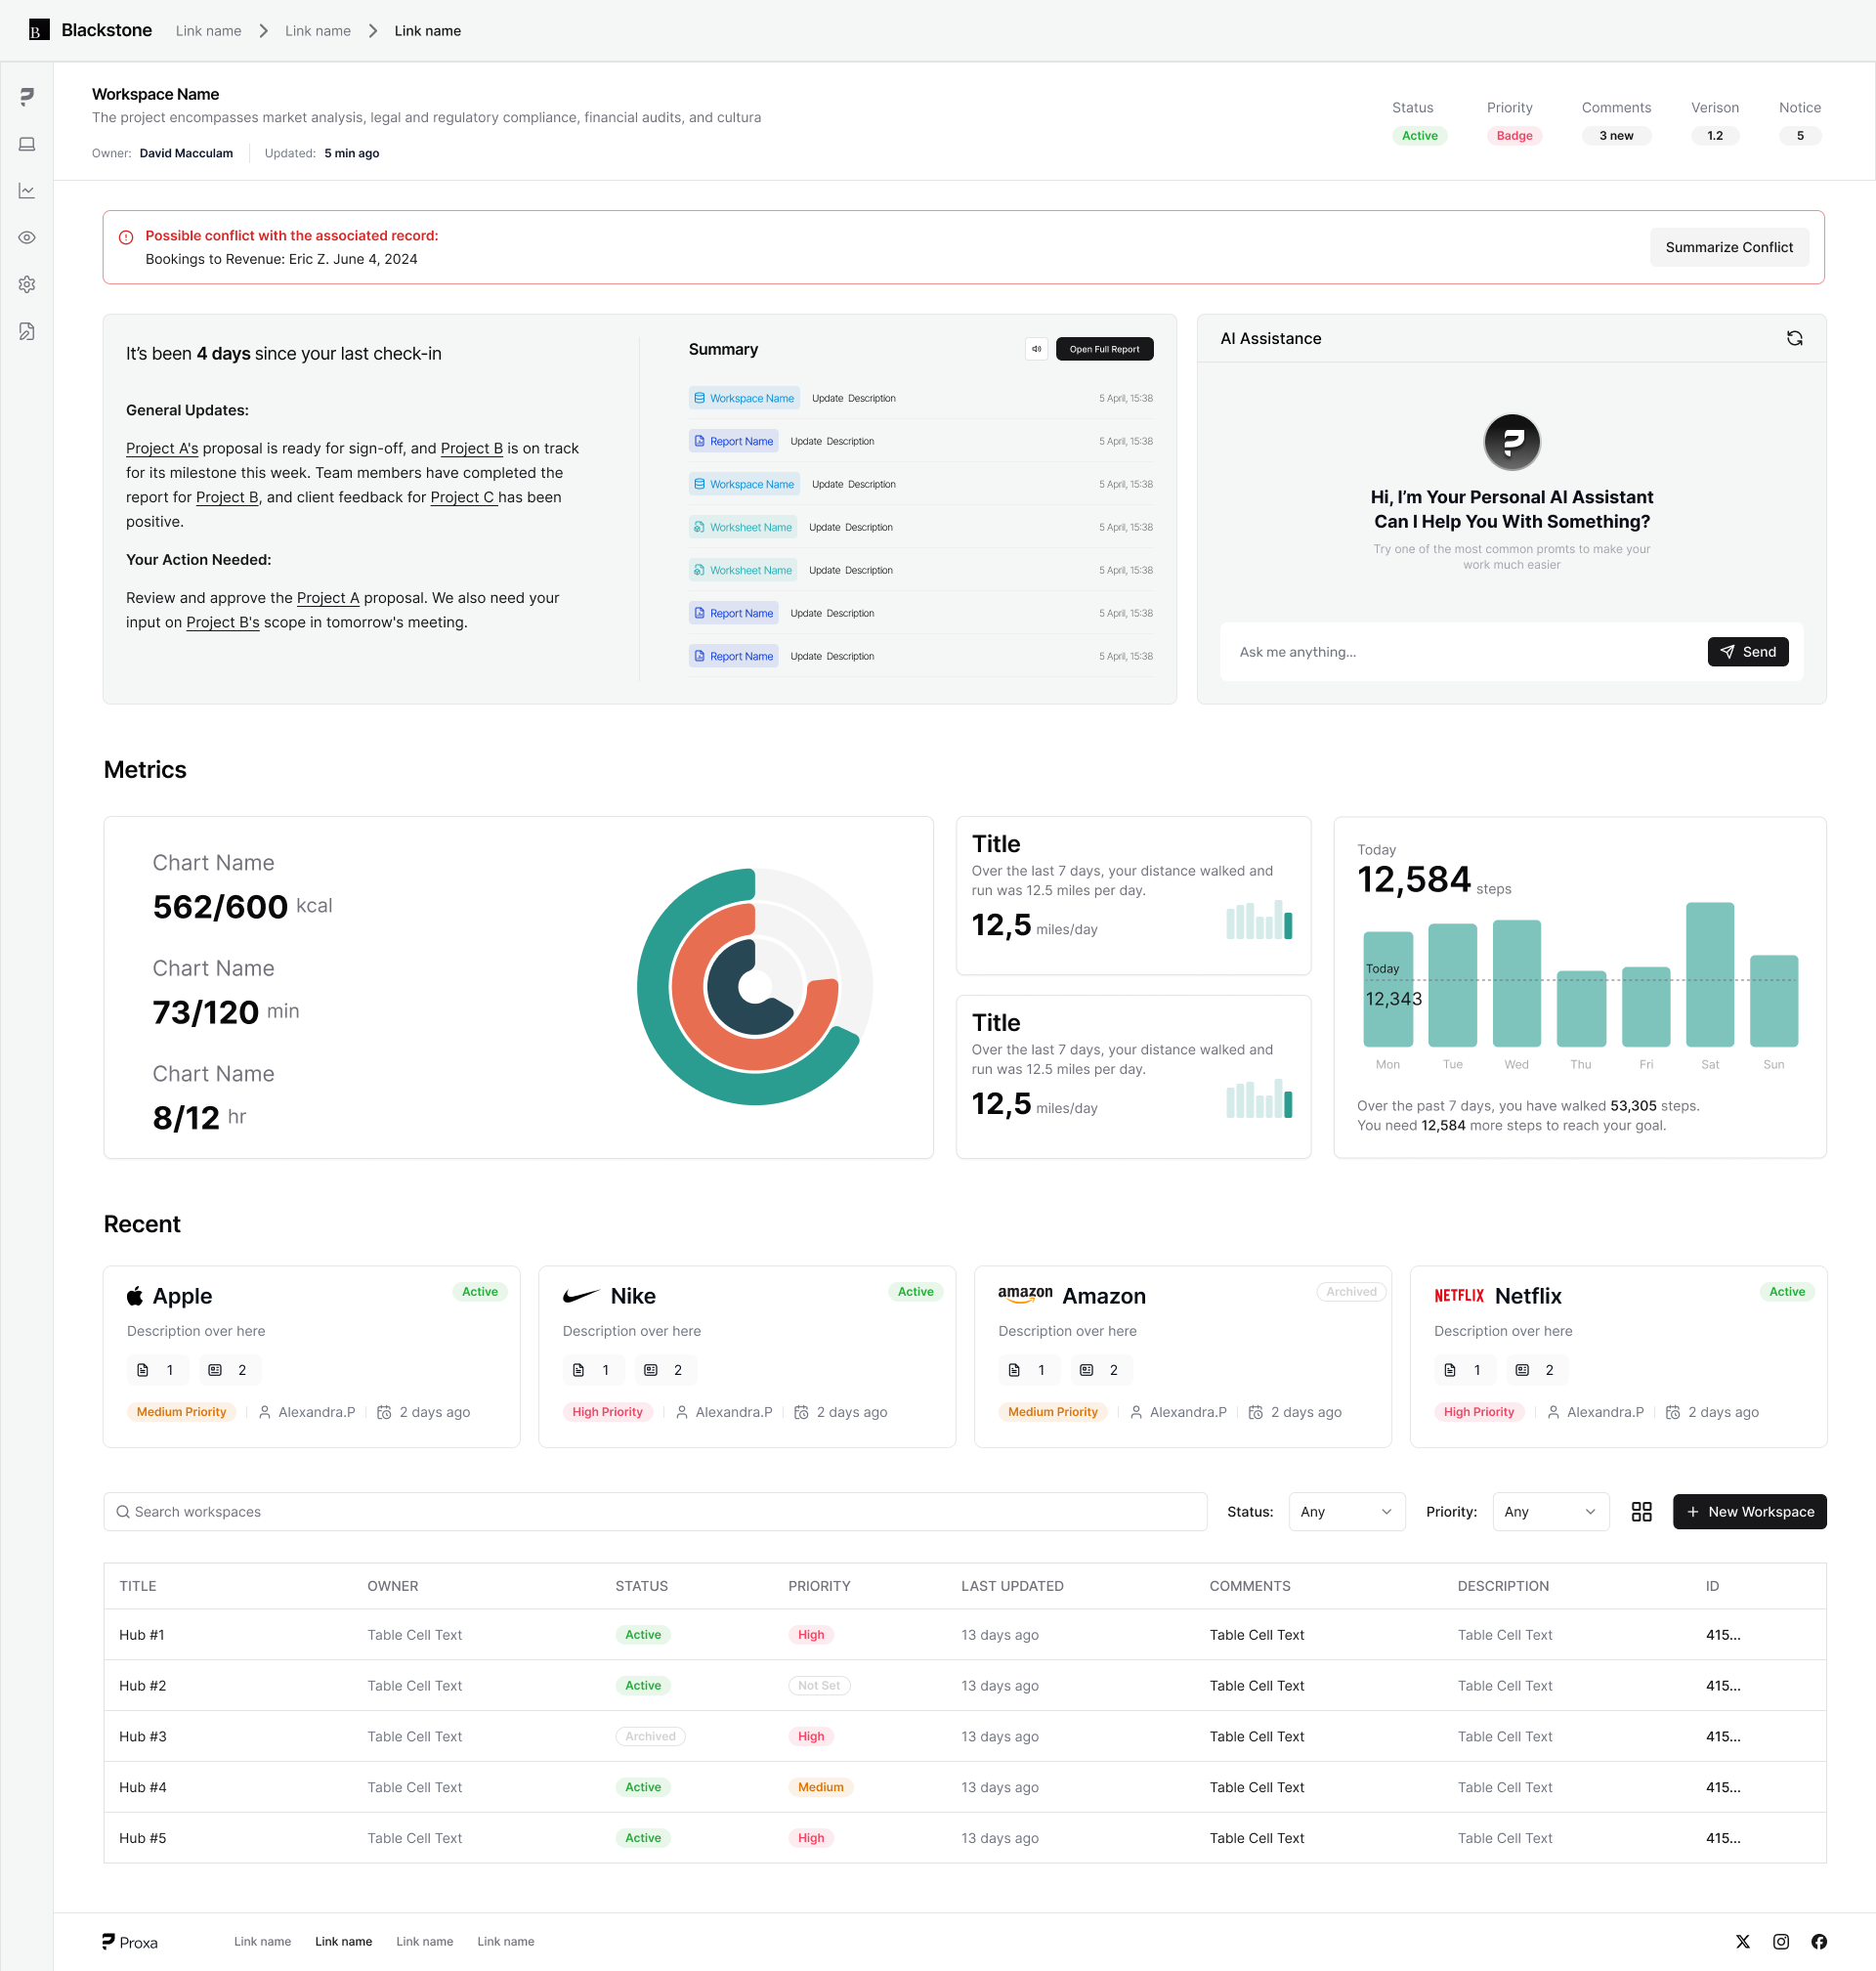
Customizable pages aggregating KPIs, metrics, and trends for high-level decision-making.
-
Purpose: Provide strategic overviews with actionable insights.
-
Key Features: Dynamic charts, graphs, and quick access to associated data.
-
Example Usage: Monitoring investment performance across multiple portfolios.
Metadata Component
An individual UI element showing contextual information such as status, priority, or last update.
-
Purpose: Provide quick, actionable details about the associated content.
-
Key Features: Editable inline and supports integration with other components.
-
Example Usage: Displaying “Last Updated: Nov 2024” on a report page.
Permissions Management
A feature allowing administrators to control user access to data and functionalities based on roles.
-
Purpose: Ensure secure and compliant data sharing.
-
Key Features: Role-based access control and activity tracking.
-
Example Usage: Limiting access to sensitive financial reports to specific team members.
Shared Workspaces
Collaborative environments tailored for specific projects, teams, or investment phases.
-
Purpose: Facilitate teamwork by organizing data, tasks, and content in one place.
-
Key Features: Adjustable permissions, content libraries, and dashboards.
-
Example Usage: A shared workspace for a portfolio company and investor firm to collaborate.
Sidebar
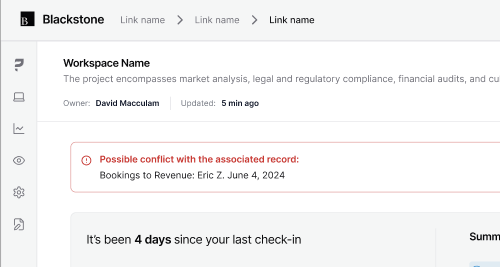
A persistent navigation element located on the side of the page.
-
Purpose: Provide users with quick access to key tools, sections, or actions.
-
Key Features: Sticky design ensuring visibility while scrolling.
-
Example Usage: Links to different dashboards or project pages.
Structured Data Pages
Centralized areas where unstructured data (e.g., files or spreadsheets) is converted into organized, actionable formats for analysis.
-
Purpose: Enable easy access and reuse of structured data.
-
Key Features: Editable, linked to worksheets for real-time updates.
-
Example Usage: Summarizing financial data in a report format for stakeholder review.
Summary Block
A content block that provides a high-level overview of critical metrics or data points.
-
Purpose: Highlight important details at a glance.
-
Key Features: Customizable metrics, linked to live data for real-time updates.
-
Example Usage: Displaying “Upcoming Deadlines: 3” on a project dashboard.
Worksheet Templates
Pre-designed worksheet formats that standardize data organization for recurring tasks.
-
Purpose: Save time and improve consistency across similar tasks.
-
Key Features: Easy duplication and pre-applied data validation rules.
-
Example Usage: Setting up a quarterly budget tracking template.
Zones
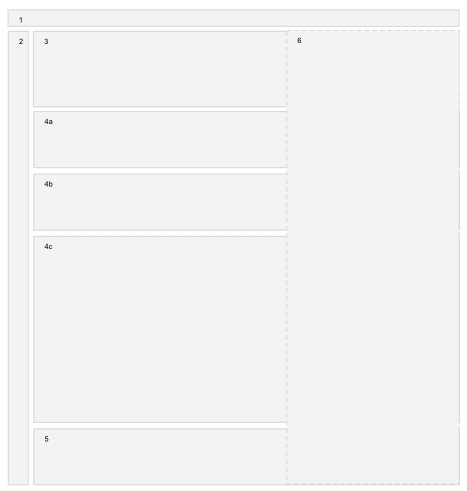
Predefined areas within a page that house content blocks and components, structuring how content is displayed.